OWE Digital Transformation &
Predictive Early Alert System
Executive Overview & Project Scope
As Industrialization Leader at Snowtex Group, I designed and implemented an OWE (Overall Work Efficiency) transformation system for Decathlon production lines. The initiative replaced manual, assumption-based performance analysis with a predictive, automated decision-making ecosystem. The organisation moved from reactive reporting to real-time performance control.
The core problem was not performance, it was the absence of an analytical operating system. This project built that system from the ground up.
| Dimension | Detail |
|---|---|
| Production Lines | 62 Decathlon lines across Snowtex Group operations |
| Users | ~10 cross-functional stakeholders. IE, Production, Management |
| Timeline | Initiated Week 27, 2024; system operational and continuously improved through 2025 |
| Technology | Google Sheets (core engine), Google Apps Script (automation), Google Data Studio (dashboards), Gemini API (AI layer — upgraded from SheetGPT) |
| Role | Industrialization Leader, sole architect, developer, and implementation owner |
| OWE Trajectory | 60% (W27 2024 baseline) → 63% (2024 YTD) → 70% (2025 YTD) |
| Stakeholder | Role | Key Interest | Engagement |
|---|---|---|---|
| IE Department | Primary analytical consumers; OWE methodology owners | Automated analysis replacing manual calculation cycles | HIGH · Co-Design Partner |
| Production Dept. | Line-level operational decision-making | Real-time intervention triggers; line performance visibility | HIGH · Decision Authority |
| Senior Management | Strategic performance oversight; Decathlon relationship | OWE trajectory evidence; QCO performance reporting | SPONSOR · Approval Authority |
| Decathlon (Client) | External performance standard-setter and recipient | Sustained OWE & QCO improvement; reporting transparency | EXTERNAL · Recognition Authority |
| IT / Google Workspace | Infrastructure and access management | Stable, maintainable architecture within approved toolset | LOW · Technical Support |
Problem Statement & Current State Assessment
Before this project, Decathlon OWE management had no structured analytical foundation. Performance visibility was retrospective, root cause analysis was qualitative and non-measurable, and decisions ran on institutional memory rather than data.
Root gap identified: No analytical operating system existed. All six structural deficiencies below trace back to a single absence, there was no data infrastructure to capture, process, or act on production performance in anything less than a week.
| Deficiency | Root Cause | Operational Impact | Priority |
|---|---|---|---|
| No structured data-driven decision system | Performance managed through experience and intuition; no analytical framework existed | Decisions made without measurable basis; no consistent decision logic across shifts | CRITICAL |
| Generic, non-measurable root cause analysis | RCA conducted verbally or through unstructured notes; no KPI linkage | Recurring issues unresolved; corrective actions not tracked to outcome | CRITICAL |
| No predictive or early-warning mechanism | All monitoring retrospective, end-of-week OWE revealed problems after the opportunity to intervene had passed | Under-performing lines identified too late for mid-week correction | CRITICAL |
| Manual reporting consuming ~4 days/week | No automation; 3 dedicated personnel required for each weekly analysis cycle | 96 person-hours consumed per cycle; analytical bandwidth unavailable for strategic work | HIGH |
| No visibility into KPI interdependencies | SAM–SOT, DR%, efficiency, quality, and availability tracked in isolation | Cross-KPI patterns and drivers invisible; management lacked levers for targeted intervention | HIGH |
| Delayed intervention on underperforming lines | Without mid-week signals, production managers had no actionable trigger until end-of-week data was available | Entire weeks lost to undetected underperformance; OWE drag compounded | HIGH |
Key diagnostic finding: The absence of mid-week visibility was the single most costly structural gap. Without it, any given week's OWE outcome was fixed by Wednesday, but not discovered until Friday or beyond.
Solution Architecture. OWE Intelligence Ecosystem
The solution has five integrated components, each handling a different layer of the analytical gap. They run as a continuous loop: data capture, statistical analysis, dashboard visualisation, predictive alerting, then AI-assisted decision support.
The OWE Intelligence Ecosystem runs as a Google Data Studio dashboard cluster with five integrated views: line trend analysis, layout line performance, early alert status, scenario simulation, and AI action recommendations. The screenshot below shows the live system as deployed across 62 Decathlon lines.
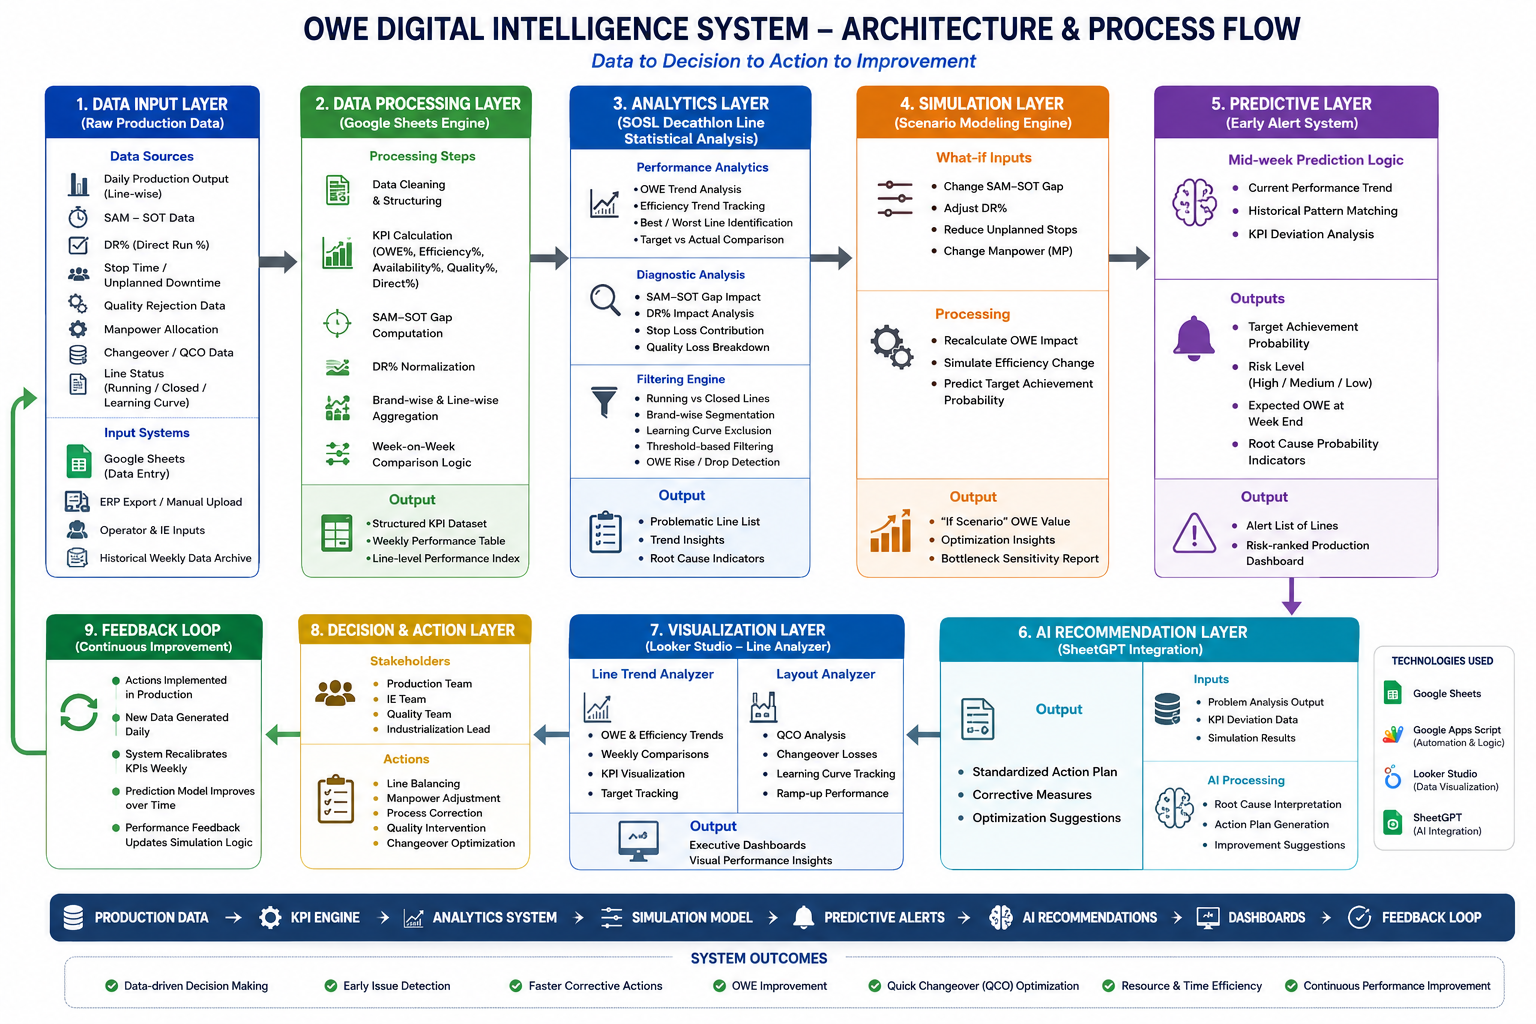
Weekly and comparative (Week-on-Week) analysis across all 62 lines. OWE and efficiency trend correlation with best/worst line identification and target OWE alignment tracking.
Unified tracking of seven KPIs, four OWE formula components (Performance %, Availability %, Quality %, Direct %) and three supporting diagnostics (DR%, SAM–SOT Gap, Efficiency) — with interdependency visibility across all dimensions.
Running / closed line segmentation, brand-wise filtering, learning curve inclusion/exclusion, OWE drop/rise detection, and threshold-based KPI classification.
"What-if" OWE recalculation: if DR% changes, if SAM–SOT gap is closed, if performance variation is removed. Enables target OWE forecasting before interventions are deployed.
Multi-week performance tracking with OWE vs Efficiency trend visualisation, target hit-rate monitoring, and KPI correlation view. Designed for management review and IE analytical deep-dives.
Quick Changeover (QCO) tracking and changeover loss analysis. Ramp-up and learning curve modelling. Max/min OWE and efficiency benchmarking for layout-specific performance comparison.
A mid-week forecasting engine that predicts end-of-week OWE outcome. Interventions can be made before the performance loss is locked in.
The system predicts whether each line will achieve its target OWE before the week ends, producing probability scores, root-cause indicators, and mid-week intervention triggers for at-risk lines.
Supports real-time scenario testing against live line data. Adjust operational levers and the engine recalculates projected OWE and target feasibility.
| Input Variable (Adjustable) | System Output (Auto-Calculated) | Decision Value |
|---|---|---|
| SAM–SOT Gap | Projected OWE with gap closed | Quantifies the exact OWE gain from closing method–time alignment |
| DR% (Defect Rate) | Projected Quality % change → OWE impact. DR% is a diagnostic metric; its effect on OWE flows through Quality % — a higher defect rate reduces Quality %, which reduces OWE proportionally | Prioritises defect reduction and quality intervention decisions |
| Unplanned Stoppages | Availability impact on projected OWE | Justifies maintenance or process intervention investment |
| Manpower (MP) | Direct % recalculation → OWE formula impact (Direct Ratio = Direct ÷ (Direct + Indirect)); plus efficiency and capacity recalculation. Manpower changes affect OWE both directly through the Direct Ratio multiplier and indirectly through line efficiency | Enables right-sizing decisions before deployment |
Gemini API is integrated via direct Google Apps Script connection to generate root-cause-based action plans, corrective action suggestions, and operational recommendations directly from the SOSL engine outputs. Originally built with SheetGPT as the AI layer; subsequently upgraded to a direct Gemini API integration for improved response quality, reliability, and native alignment with the Google Workspace ecosystem.
Eliminated dependency on manual IE analysis logic. What previously required an experienced IE analyst to interpret and frame, the AI layer converts to structured, actionable recommendations automatically.
Implementation Approach & Phasing
The system was built and deployed across five sequential phases. Each phase required a confirmed deliverable before the next began, so no component was built on unvalidated foundations.
Four KPIs are the direct multiplicative components of OWE: Performance %, Availability %, Quality %, and Direct % (OWE = Performance × Availability × Quality × Direct Ratio). The remaining three. DR%, SAM–SOT Gap, and Efficiency, are causal and diagnostic metrics that drive those components. All seven are tracked, correlated, and interdependency-mapped within the SOSL engine. This cross-KPI architecture was the foundation for meaningful scenario simulation and predictive modelling.
| KPI | OWE Role | Primary Lever | Tracked In |
|---|---|---|---|
| Performance % | Output rate vs. standard | SAM–SOT gap, method compliance | SOSL Engine + Early Alert |
| Availability % | Planned vs. actual operating time | Unplanned stoppages, changeover duration | SOSL Engine + Layout Line Analyzer |
| Quality % | Good output rate. Good Output ÷ (Good Output + Reject). Measures the proportion of defect-free pieces produced at line inspection. Higher = better. Distinct from DR%: Quality % is a piece-level pass rate at line inspection (higher is better); DR% is the audit-based defect rate across the production run (lower is better). The two metrics are directionally opposite. Quality % contributes positively to OWE; DR% is a loss indicator. | Defect root cause, operator skill | SOSL Engine |
| Direct % & DR% | Direct %: OWE formula component. Direct ÷ (Direct + Indirect Manpower). Measures the proportion of direct workers on the line; enters OWE directly as the Direct Ratio multiplier. · DR%: Diagnostic metric. Defect Rate as proportion of defective output. Not a formula component; used to diagnose Quality % performance and drive corrective action. | Manpower allocation, absenteeism; defect root cause, quality compliance | SOSL Engine + Simulation |
| SAM–SOT Gap | Method-time alignment indicator | IE standard setting, operator training | SOSL Engine + Simulation |
| Efficiency | Overall operator and line throughput | Learning curve, layout stability | Layout Line Analyzer |
Layer
Layer
Layer
Business Impact & Measured Results
Impact: 2 analysts (IE team) now complete the full weekly intelligence cycle in 1 hour per day over 6 days (12 person-hours/week) — compared to 3 dedicated personnel spending 4 full days (96 person-hours) on the equivalent manual process. A further ~8 cross-functional stakeholders across Production and Management consume dashboard outputs directly, requiring no additional analytical effort. The liberated capacity was redirected to strategic IE work.
Received formal appreciation from Decathlon for sustained "Good OWE & Quick Changeover (QCO) Management & Improvement" — validating the system's impact not only internally but at the client-facing performance standard.
Requirements Elicitation & Non-Functional Requirements
Requirements for this project were elicited through Snowtex–Decathlon weekly Sum meetings — a structured operational review cycle involving Decathlon's dedicated Industrialization, Quality, and Supply Chain specialists embedded with Snowtex as part of the standard buyer–supplier partnership model. Performance standards, OWE targets, alert thresholds, and reporting expectations were captured from these sessions and translated into system specifications. No formal requirements document was produced by Decathlon. Translation of buyer performance standards into functional system requirements — including the predictive modelling logic, alert threshold calibration, and dashboard reporting structure — was owned entirely by the BA. Requirements were refined iteratively across weekly review cycles rather than captured in a single elicitation event.
| ID | Category | Requirement | Acceptance Threshold | Status |
|---|---|---|---|---|
| NF-01 | Availability | OWE performance data, trend analysis, and predictive alerts must be ready before the weekly Decathlon Sum meeting. Data presented must reflect the most recent completed production period — not the previous week's figures. | System output confirmed current and available before each weekly Sum meeting throughout the deployment period. No meeting held on stale data post go-live. | MET |
| NF-02 | Forecast Accuracy | Predictive OWE model must achieve measurable and reportable forecast accuracy against actuals — qualitative assessment is not acceptable as a performance measure for a system replacing manual judgement. | 90.1% forecast accuracy achieved across 62 production lines. Exceeds the internal target of ≥85%. | MET |
| NF-03 | Operability | System must be fully operable by Snowtex IE and Production teams without Decathlon technical involvement. Decathlon defines the performance standards; Snowtex operates the measurement and response system independently. | All alert response, root cause analysis, and corrective action initiated by Snowtex IE team using system outputs — no Decathlon technical input required post go-live. | MET |
| NF-04 | Compliance | OWE reporting structure and KPI definitions must align with Decathlon's OPEX industrialization standard. Any deviation from Decathlon's defined measurement methodology must be explicitly approved before deployment. | Reporting structure confirmed against Decathlon OPEX standards before go-live. OPEX Level-B (73%) achieved — first Decathlon supplier in Bangladesh to reach this milestone. | MET |
Risks, Assumptions, Constraints & Lessons
| Risk | Category | Likelihood · Impact | Mitigation | Outcome |
|---|---|---|---|---|
| Prediction model drift, accuracy degrading as production mix changes | Technical · Model | Medium · High | Model validated against historical data before deployment; monitored against actuals each week; recalibration protocol defined | MITIGATED — 90.1% accuracy maintained across running lines post-deployment. |
| Low stakeholder adoption, users defaulting to manual analysis despite system availability | People · Change | Medium · High | Dashboard designed for non-technical users; IE and Production teams involved in requirements; weekly review cadence built around dashboard outputs | MITIGATED — ~10 active users across IE, Production, and Management consuming dashboards as primary intelligence source. |
| Gemini API recommendation quality. AI generating generic or incorrect action plans | Technical · AI | Medium · Medium | Prompt engineering grounded in OWE-specific context; recommendations reviewed by IE before actioning; treated as first-draft, not final authority | MITIGATED — AI layer used as analytical accelerator with IE oversight maintained. |
| Data quality, incorrect ERP or shift data corrupting OWE calculations | Data · Infrastructure | Low · Critical | Validation logic built into SOSL engine; anomalies flagged before processing; cross-check against prior week as sanity control | MITIGATED — No material data quality incident post-deployment. |
| Google Workspace dependency, service disruption blocking weekly analysis | Infrastructure | Low · Medium | Ecosystem designed within approved corporate toolset; no external dependencies; Apps Script logic documented for recovery | MITIGATED — No service disruption impacting analysis cycles. |
| Assumption | Owner | Validation Status | Impact if Incorrect |
|---|---|---|---|
| Production mix across 62 lines is sufficiently stable for weekly comparative analysis | Planning / IE | VALIDATED — Line segmentation (running/layout/closed) handled dynamically within the filtering system. | Cross-line comparison would require recalibration if production mix shifted materially |
| Mid-week data is available in sufficient volume to power the Early Alert model | Production / IT | VALIDATED — Mid-week data collection protocol established and integrated into the alert trigger logic. | Alert model cannot generate valid predictions without mid-week inputs, falling back to end-of-week analysis only |
| Stakeholders have baseline Google Sheets and Google Data Studio literacy to consume outputs | IE / Management | VALIDATED — Dashboard designed for non-technical consumption; onboarding sessions conducted at rollout. | Adoption would stall without accessible interface; analytical value would remain locked in the engine |
| Senior management commitment to weekly OWE review cadence will be sustained post-deployment | Senior Management | VALIDATED — Weekly review embedded as standing management cadence; dashboard is the agenda artefact. | Without sustained review, the system degrades from an intelligence tool to an unused database |
- Technology: All infrastructure required to operate within Google Workspace, no external software licences allocated. This drove the Apps Script automation approach and Gemini API integration as the AI layer (upgraded from initial SheetGPT implementation)
- Analytical timeline: Each analysis stage must be completable within the same working day its input data becomes available, ensuring insights are always current and no lag exists between data availability and decision readiness
- Data entry: Input mechanisms designed to be completable without adding material burden to production operators or line supervisors
- Change authority: No formal authority over line-level production teams, adoption required demonstration of value and management sponsorship rather than mandate
- Model interpretability: Predictive model required to be explainable to non-technical production managers, black-box accuracy without interpretable outputs would have blocked adoption
Two line categories are excluded from Early Alert classification: closed lines and lines with fewer than 4 production run days in the current week. The model operates across running lines and learning curve lines only, both have validated accuracy scores (90.1% and 88.8% respectively). Excluded lines are tracked analytically within the SOSL engine but do not receive a mid-week probability score or alert classification.
Closed lines: permanently excluded due to no active production data. These lines appear in SOSL end-of-week reporting only and are flagged as inactive within the filtering system.
Sub-4-day lines: lines that have been running for fewer than 4 days in the current week, including newly started lines, lines returning from extended closure, or lines restarted mid-week after a stoppage event, do not have sufficient data density for reliable prediction. These lines re-enter the alert feed automatically once the 4-day threshold is met.